Using MATLAB's fill function with time series data
Recently, I was working on plotting some time series for a model with 6 variables. I wanted to visualize the solutions for this process as a mean model solution +/- one standard deviation, with a semi-transparent fill between the standard deviations and had a little trouble remembering how to do this.
MATLAB’s documentation tells you that the fill function makes polygons, with the vertices specified by the x and y values you supply.
```{#mycode .matlab .numberLines startFrom="1"}
x = [0 0 1 1] % x values of vertices
y = [0 1 1 0] % y values of vertices
fill(x,y,'k')
```
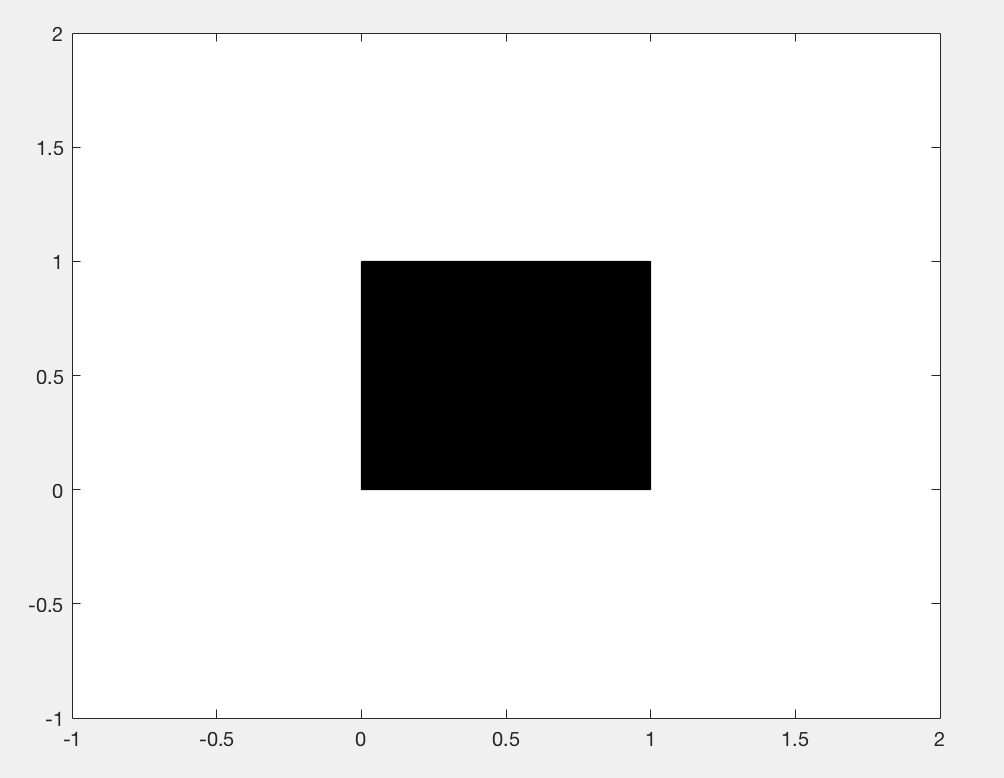

The order of the vertices matters - so while the above makes a rectangle, if the last entries of y are switched, you get a bowtie instead of a rectangle,
x = [0 0 1 1] %  x values of vertices
y = [0 1 0 1] %  y values of vertices
fill(x,y,'k')
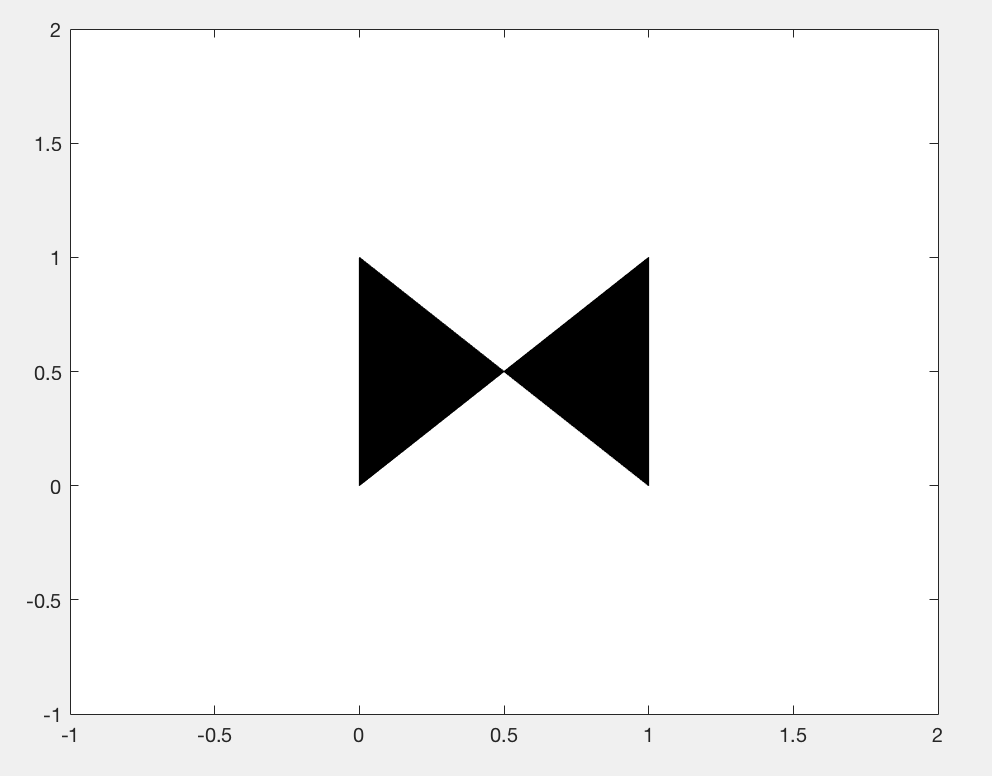
Notice that fill automatically closes the polygon by drawing a line from the last specified vertex to the initial vertex. In the case of the bowtie, from (1,1) to (0,0).
To draw time series data with those crafty standard deviation shadings, we can draw a polygon that goes “out and back”. The x values should monotonically increase, and then turn around and monotonically decrease in the same way. The trick in MATLAB is to use the
flip function, which reverses a vector.
>>> t = [1 2 3 5 8 10];
>>> full_tvec = [t flip(t)]

full_tvec =

     1     2     3     5     8    10    10     8     5     3     2     1
Very out and back.
Suppose we have a data matrix where the rows are different time points and the columns are different observations of the variable at those time points.
From this data, I can compute the mean and standard deviation at each time point.
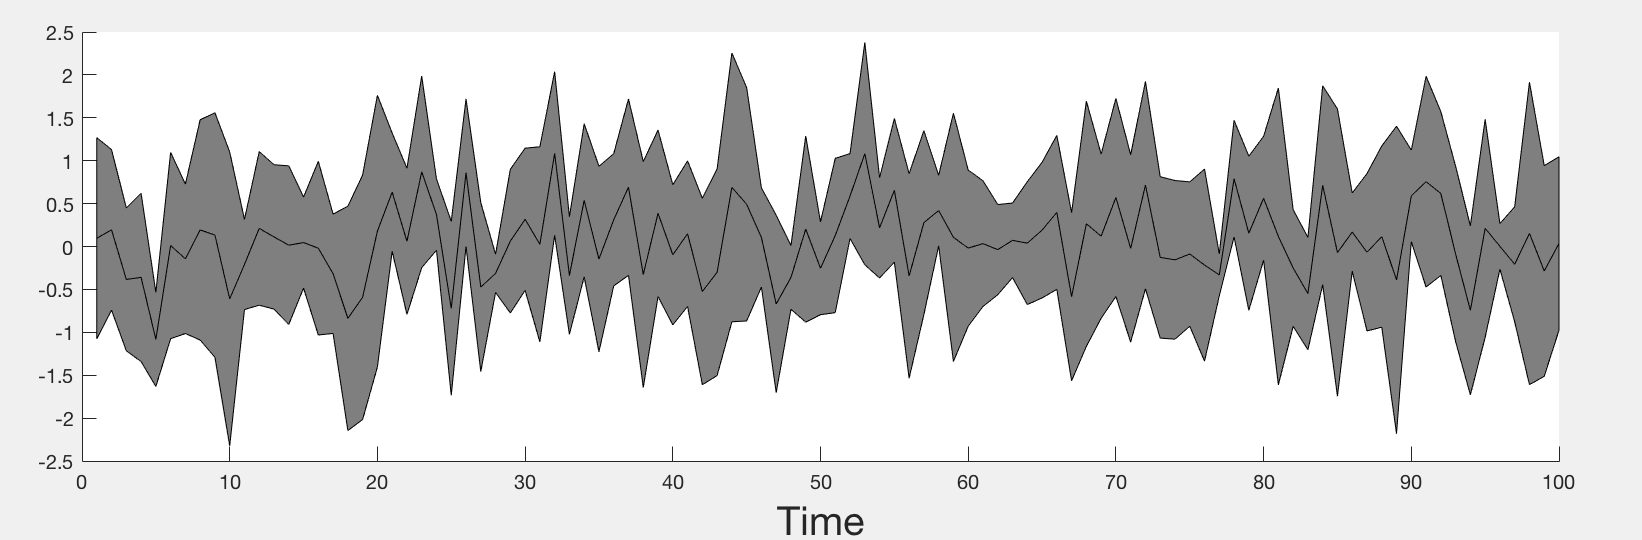
Finally, the fill function can be used to plot the time series, where the top vertices are the mean +1 standard deviation and the bottom vertices are the mean -1 standard deviation.
% Generate data
t = 1:100;
data = randn(100,5);
data_mean = mean(data,2)';
stdv = std(data,[],2)';

% Plotting
hold on
h = fill([t flip(t)],[data_mean+stdv flip(data_mean-stdv)],'k');
set(h,'facealpha',.5)
plot(t,data_mean,'k')
xlabel('Time','Fontsize',20)